
Impression Variation Dashboard Now Live in the Geopath Insights Suite!
Dashboard is now available for Geopath members
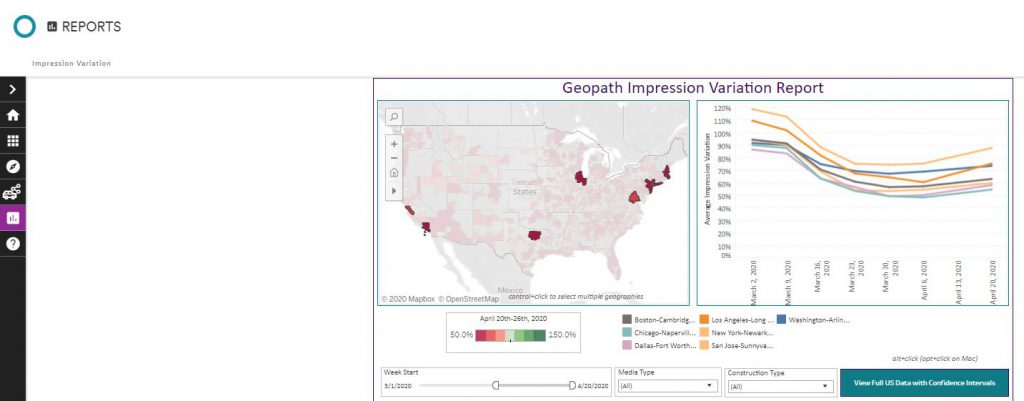
We are excited to announce that the Impression Variation Dashboard is now live in the Reports Module of the Geopath Insights Suite. Geopath members can now log-in with their current credentials to run impression variation reports using these data.
This directional data set illustrates the average variation by media type and by market across the United States compared to Geopath’s original 2020 forecast.

Please note that these metrics are not provided at the individual unit level. They are an average by media type by CBSA and should only be used to provide directional guidance.
Impression Variation Dashboard | Training Webinars
We will be hosting two training webinars next week on how to use the new Impression Variation Dashboard and answer any questions.
Register for either session, by clicking the links below:
For more information, please check out some of the educational materials below:
How to Interpret the Impression Variation Reports