Geopath Market Spotlight | Washington, DC DMA
GeekOUT Fast Fact Friday

For today’s GeekOUT Fast Fact, let’s look at the market home to the US capital – the Washington, DC DMA.
While Washington, DC is famously the nation’s capital, and deep with history, here are some lesser-known facts about the market. Did you know that at least two US Presidents have owned alligators as pets while in the White House? Presidents Herbert Hoover and John Quincy Adams each owned a pet alligator during their tenure.
The US Capitol Building, the meeting place for Congress and the legislative branch, was originally planned as the final resting place for first president George Washington. Though he chose to be buried elsewhere, there still sits an empty crypt under the building that had been intended for Washington himself. In fact, this isn’t the only underground burial site in the District. Under the “Franciscan Monastery of the Holy Land in America”, there is a replica of the Roman catacombs, built by Franciscan monks near the turn of the 20th century.
Let’s take a look at some specifics about the OOH media in this market.
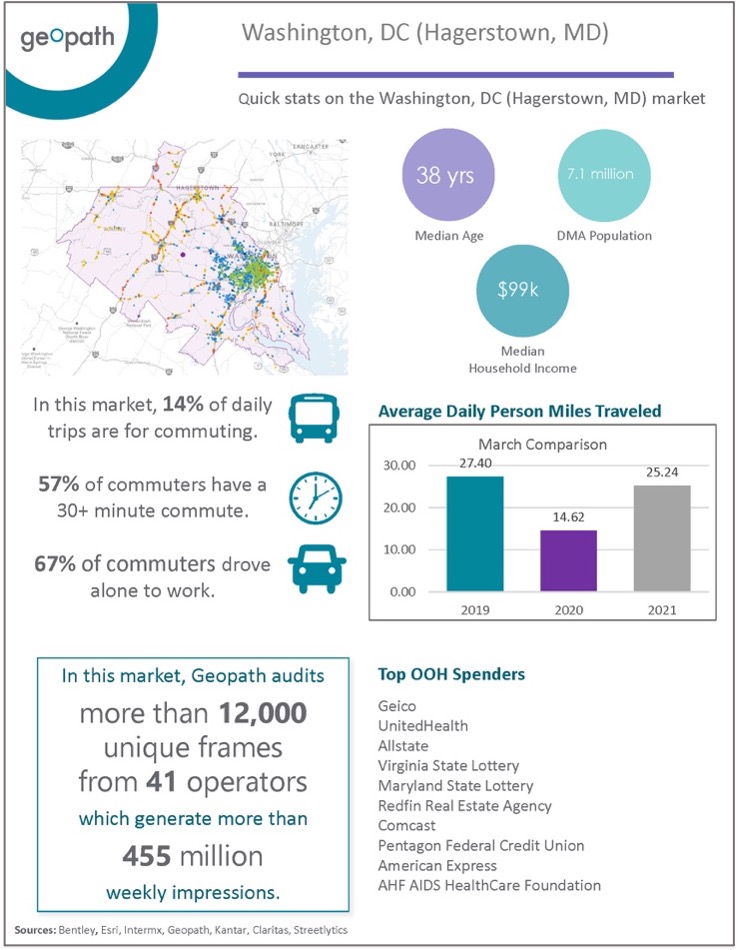
According to Geopath Insights, there are more than 12,000 spots measured by Geopath within the Washington, DC market, which generate over 455 million impressions each week! Additionally, this market has a population of over 7 million, and over 1/2 of all commuting trips within the DMA take 30 minutes or more.
For more insights on the Washington, DC DMA, please see our 2021 DMA infographic below.

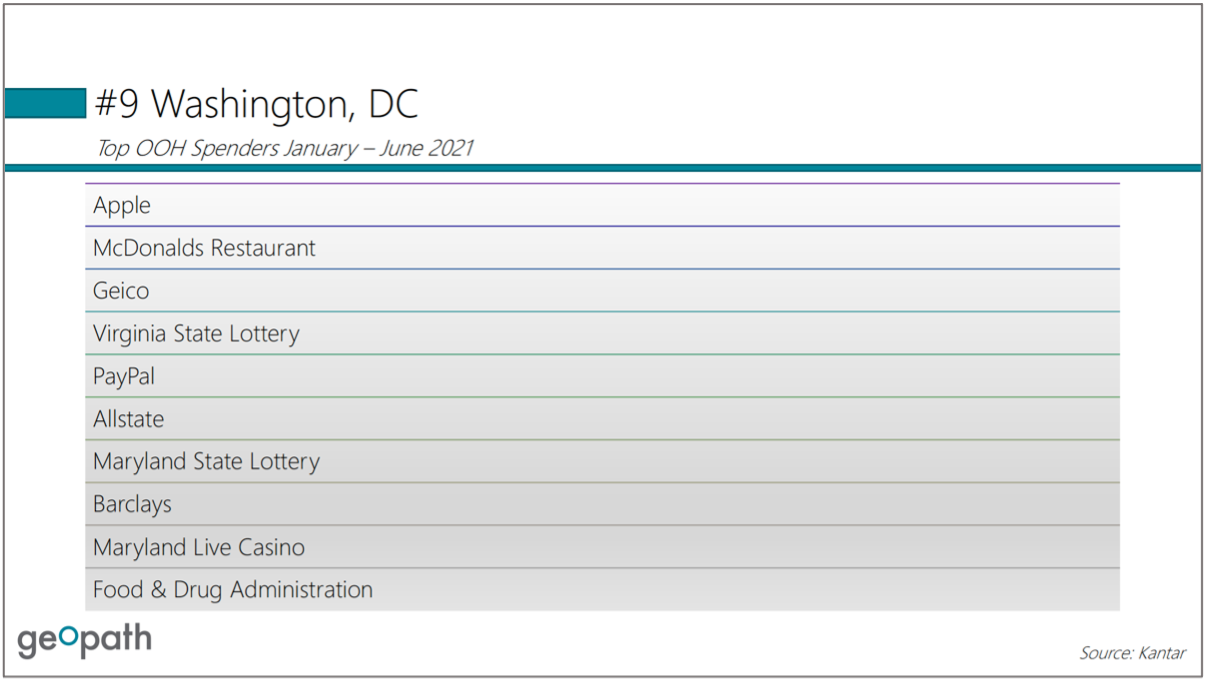
Next, let’s look at who is spending in OOH within the DMA for January – June of 2021.

It’s interesting to note that over half of the top 10 OOH spenders in this market are large, national brands. National top spenders McDonald’s and Geico appear 2nd and 3rd, respectively, while Apple takes the top spot for OOH spend in DC. Also interesting to note, because of Washington, DC’s position geographically, both Virginia and Maryland’s state lotteries appear in the top spenders for OOH.
Geopath has compiled OOH advertising spend data for Q1 and Q2 of 2021 (January-June) sourced from Kantar for the DMA, as well infographics for this and all 200+ DMAs across the country. Both the OOH spending reports, and DMA Infographics can be accessed by Geopath members in our geekOUT Library. If you are not currently a Geopath member, please reach out to us on geekout@geopath.org to find out how you can access this information.
Be on the lookout for the Q3 OOH spending report soon!
