OOH in Washington: The State by Numbers
Friday Fast Fact

For today’s Fast Fact, let’s take a look at some OOH statistics across Washington’s 43 counties!

Washington state is known for its vast, beautiful wilderness, and is home to many bountiful crops and exports. In fact, Washington is the largest producer of both apples and hops in the United States. Washington is also home to some unique engineering marvels, such as the Evergreen Point Floating Bridge, also known as the 520 Bridge. The Evergreen Point Floating Bridge is the longest floating bridge in the world, as of its opening in 2016. It actually beat its own record, after replacing a slightly shorter bridge of the same name, in the same location, that was originally built in 1963!
At the state level, Geopath audits over 36,000 spots, with inventory coming from 42 different operators! In the state, there is a total population of 7.8 million.
Here are a few great potential audience segments to be aware of in the state! 2/3 of the state’s population reports that they have been to a Quick Service Restaurant to eat in the past 30-days, and a full 93% have been to a sit-down restaurant in the same time period! According to Geopath Insights Data, there are more dog owners in the state than cat owners, at 26% of the population versus 15%, respectively. There are also more wine drinkers in the state than beer drinkers, with wine leading by a difference of 11% of the state’s population!
In the past 12-months, 20% of state residents have been to a theme park, 18% to the zoo, and 24% to a casino. Of the 7.8 million Washingtonians in the state, 21% report that they have been biking, 18% have been jogging/running, and 14% have been camping in the past 12 months. 1/3 have gardened in the last 12 months, and over 42% of residents report that they have grilled outdoors in the same time frame. Additionally, nearly 1/3 report that they regularly attend religious services.
In the coming 12 months, nearly 1/3 of the population report that they have plans to go on a family vacation, and nearly 1/3 plan to do some home remodeling.
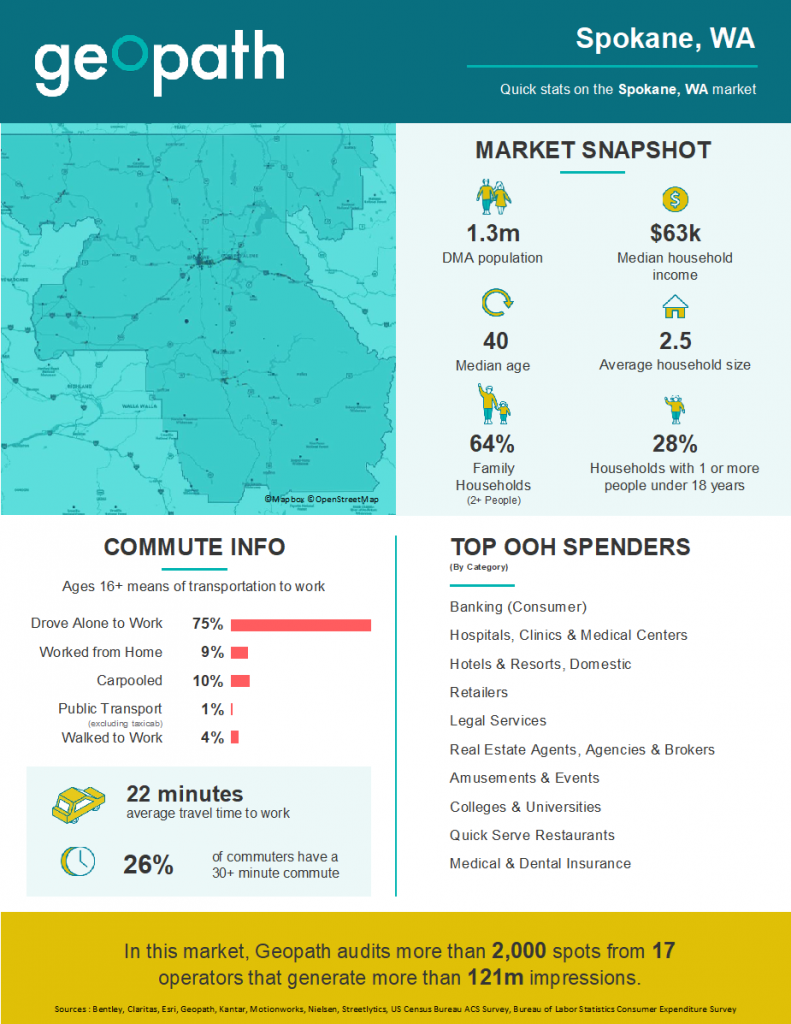
Here is the latest infographic on the Spokane DMA!

There are more infographics on the way! Don’t see a market you are looking for? Reach out to us at geekOUT@geopath.org. Additional Market Spotlights will be added over the coming weeks.
