
Geopath Announcement| Impression Variation Dashboard
Impression Variation Dashboard Now Updated with Midyear Annual Forecast
The Impression Variation Dashboard has been updated with the Midyear Annual Forecast. Members are now able to compare the recently released Midyear Annual Forecast against the weekly observed data.
We thank you for your patience as we worked to expand the capabilities of the current Impression Variation Dashboard and conducted additional testing. Below are answers to some frequently asked questions to help our members as they access the updated dashboard.
What do the data in the dashboard represent?
The Impression Variation Dashboard allows members to compare a week of observed activity versus the expected monthly average. This provides a precise view of forecasted versus observed delivery because the variation is relative to the expected seasonality of the audience delivery of OOH media types in a market (CBSA). This also allows Geopath, and our members, a way to continually monitor how well the current forecast is reflecting the reality of what we are observing and determine the need for issuing additional annual forecasts.
Will variation reports for place-based media be available in the Impression Variation Dashboard?
Yes, place-based media will be available in the Impression Variation Dashboard on Monday, July 26th. Similar to other media classes available in the dashboard, members will be able to compare various media types by market (CBSA) for place-based media. Note, impression variation reports for additional media classifications (scheduled/dynamic fleet and transit station) will be released as those media are added to the published database.
How frequently will the dashboard be updated?
These metrics will continue to be calculated and provided weekly with data from two weeks prior. For example, the update on July 26th will include the week of July 4th – July 11th.
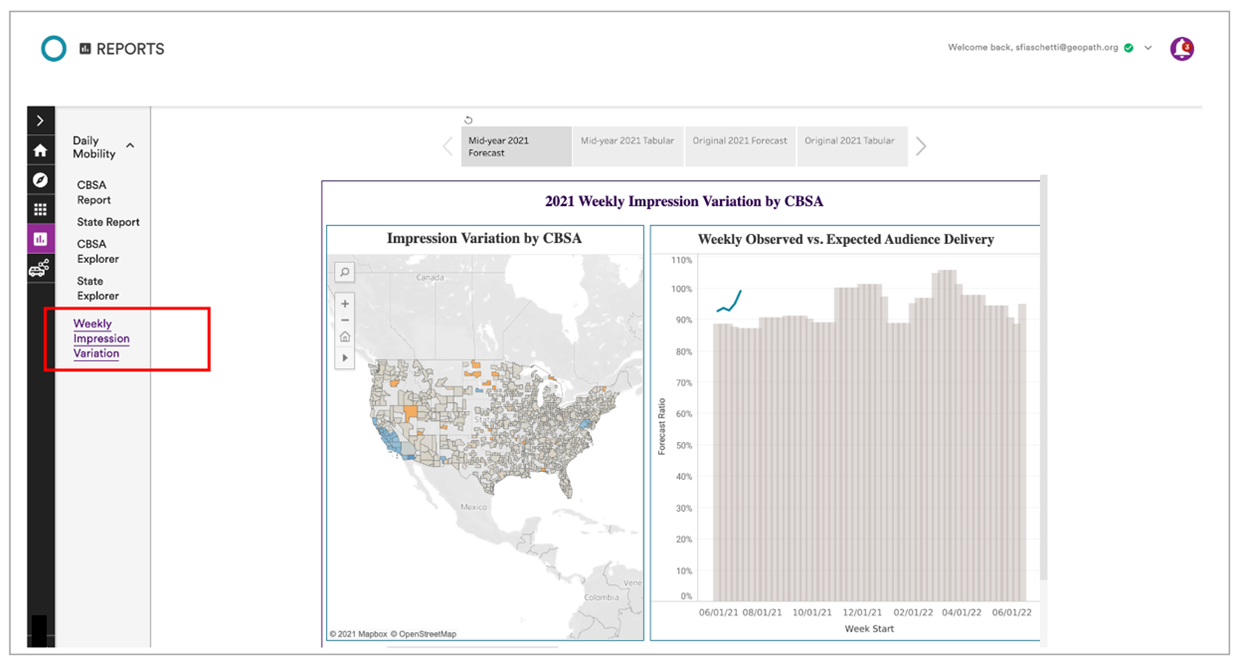
Where can I access the Impression Variation Dashboard?
The Impression Variation Dashboard is available in the Geopath Insights Suite. Members can access the dashboard by logging into the Insights Suite and clicking on the Reports Module. The Impression Variation Dashboard is currently the default dashboard in the module.
Is the Jan 2021 – Dec 2021 annual forecast still available in the dashboard?
Yes, the Jan 2021- Dec 2021 annual forecast is still available in the Insights Suite. Members can access this data by toggling between the two data sources.

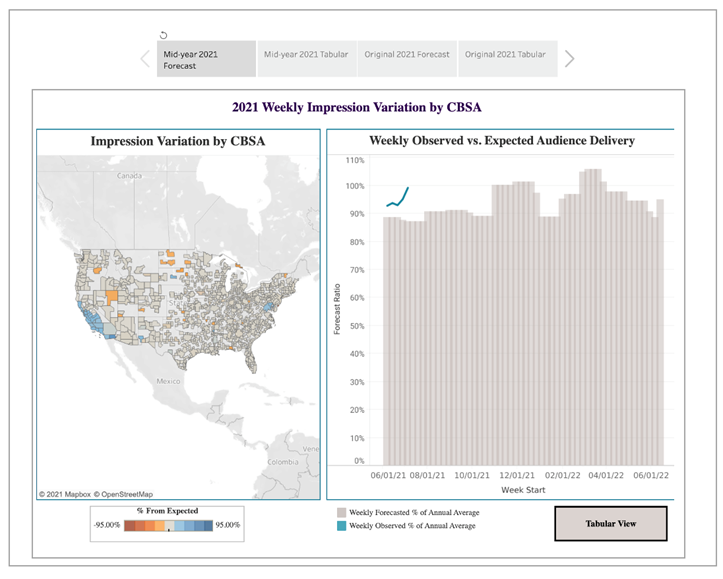
What do the bars and lines represent?
The expected audience delivery (grey bars) represents the expected delivery for that media type based on the annual forecast. For example, if one of the bars was at 90%, this would mean for that week, the media type selected is expected to deliver 10% less total impressions than the average annual week across the forecast period (June 2021-May 2022). Similarly, if it was 110%, it would be expected to deliver 10% more impressions for that week as compared to an average annual week.
The weekly observed metrics (blue line) leverage our near real-time mobile data and represent delivery for the media type selected. These data are compared against the expected weekly delivery (grey bars) for the month. In the example below, the inventory type delivered 4.85% more impressions for the week of 6/21/21 than was forecasted in the midyear annual forecast for the average week in June 2021.

How do I use the dashboard to run variation reports?
The Geopath team has put together a short video tutorial on how to use the Impression Variation Dashboard. You can watch the video by clicking on the image below, or by going to the GeekOUT Library.

Where can I find additional information?
We hope this helps to answer many of the questions our members may have related to the Impression Variation Dashboard, but please feel free to reach out directly to geekOUT@geopath.org with any additional questions. We would be happy to set up a custom training for you and your organization.